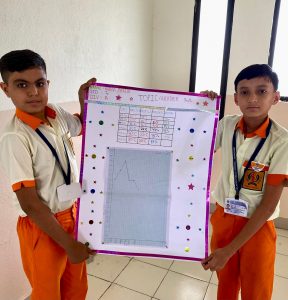
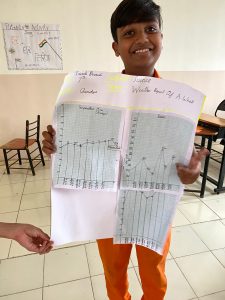
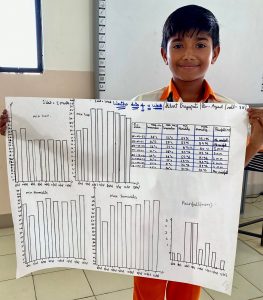
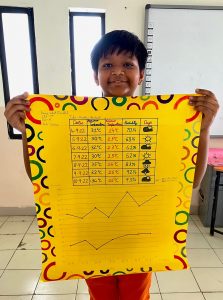
Graphical Representation of Weekly Weather Report
The best and easiest way to understand the fluctuations and stats of any data is Graphical Representation. The students of Eklavya Public School made a Graphical representation of the weekly weather report to gain insights of various parameters of the same.
Recent Posts